
Most business owners believe that if they just had more data, they would make better decisions. They invest in complex dashboards, hire analysts to track every click, and wait for monthly reports to arrive like a verdict from a distant court.
However, the reality of modern digital marketing is far more unforgiving. You don’t lose money because you lack data; you lose money because you take too long to interpret it. While you wait for a “statistically significant” sample size or a pixel-perfect attribution report, your competitors are already pivoting. The gap between data collection and the actual decision is where your opportunity leaks away.
We call this the “Velocity of Insight.” In a marketplace that moves at the speed of a refresh button, your competitive advantage isn’t found in the volume of data you hoard: it’s found in how fast you can turn a signal into a strategic move.
The Cost of the “Wait-and-See” Strategy
Many local service businesses and e-commerce brands treat analytics as a rearview mirror. They look at what happened last month and try to adjust for next month. But if your cost-per-lead spikes on Monday and you don’t realize it until the following Friday, you’ve spent five days subsidizing an inefficient campaign.
The cost of slow decisions is compounded by the “Interpretation Gap.” As we’ve explored previously, being rich in data but poor in direction creates a paralysis that stalls growth. When data sits idle in a dashboard, it isn’t an asset; it’s an overhead.
“The real competitive advantage in the next decade won’t belong to the companies with the most data, but to those who can compress the time between signal and action to near-zero.” : Industry Insight on Digital Agility
To increase your velocity, you must stop treating every metric as equal. You need to distinguish between a “metric” (a measurement of what happened) and an “insight” (a discovery that dictates what to do next).
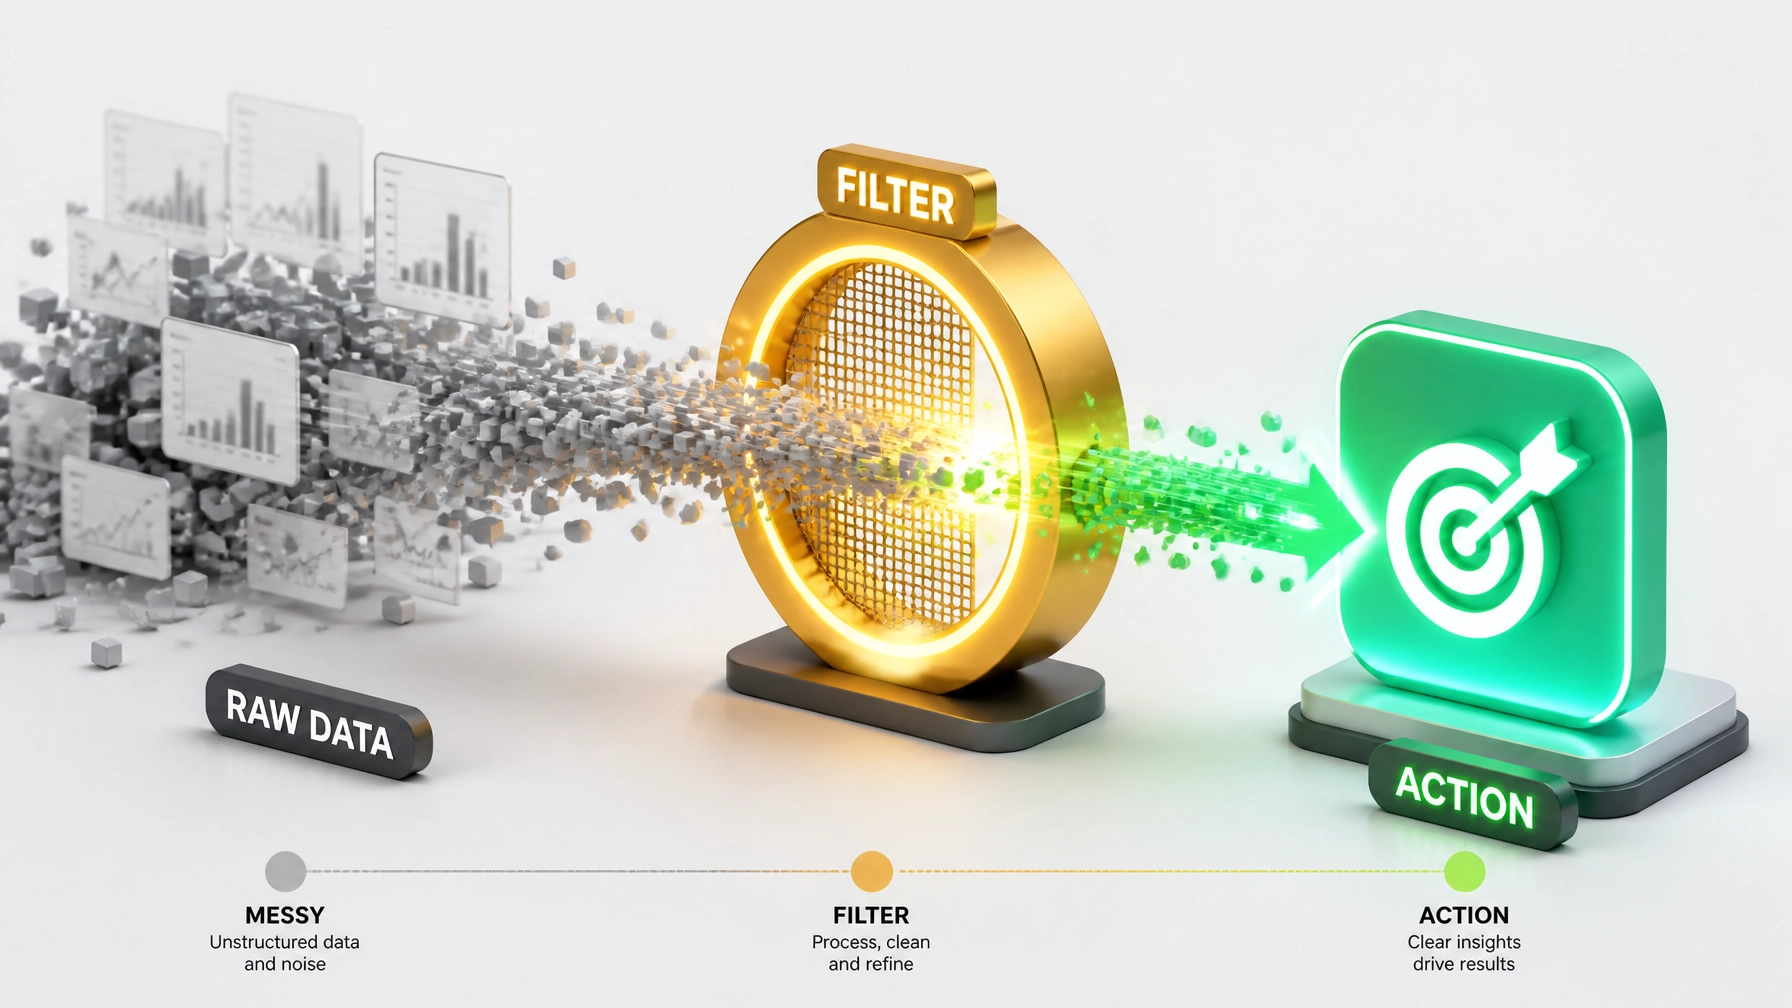
Metrics vs. Insights: The Decision-Speed Lens
To move faster, your team needs “decision-ready data.” This means moving away from vanity metrics that offer comfort but no clarity. If a number doesn’t tell you to change something, keep something the same, or stop something entirely, it isn’t an insight.
The following table breaks down common marketing data points through the lens of decision velocity.
| Category | Vanity Metric (Slow/Reactive) | Business Insight (Fast/Actionable) | Decision Velocity Action |
|---|---|---|---|
| Paid Media | Total Impressions | Click-Through Rate (CTR) by Creative | Swap underperforming ad visuals within 48 hours. |
| Website | Average Session Duration | Drop-off point in the checkout funnel | Remove friction or technical bugs at the specific step today. |
| Local SEO | Total Map Views | Direction Requests vs. Phone Calls | Adjust GMB “Service Area” or “Categories” based on intent. |
| Total Sent Emails | Click-to-Open Rate by Segment | Immediately refine the offer for the non-responsive segment. |
By focusing on the right column, you aren’t just observing your business; you’re actively steering it. This is how you avoid the performance mirage where your numbers look good on paper, but your revenue remains stagnant.
Finding the Signal: Behavior over Attribution
One of the biggest drags on decision speed is the obsession with “perfect” attribution. Marketers often spend weeks trying to figure out if a lead came from a Facebook ad, a Google search, or an organic referral. While attribution matters, the quest for a 100% accurate “first-touch” or “last-touch” model often leads to “Decision Debt.”
Instead of waiting for a perfect map of the customer journey, look for behavioral signals. For example, if you notice that users who visit your “Pricing” page and then your “FAQ” page have a 40% higher conversion rate, that is a high-velocity insight. You don’t need to know exactly which ad brought them there to know that you should make the link between those two pages more prominent.
This approach focuses on the architecture of certainty. When you understand the behavior that leads to a conversion, you can optimize the path in real-time rather than waiting for an end-of-month attribution audit.

The Paradox of Precision: Why “Good Enough” Wins
There is a psychological trap in analytics called the “Paradox of Precision.” It’s the belief that more precision leads to better results. In reality, waiting for a 99% confidence interval often costs more in lost time than the risk of acting on an 80% confidence interval.
In the world of local services: where you might be a contractor, a dentist, or a lawyer: the market doesn’t wait for your data to be perfect. If you see a leading indicator (like a sudden drop in phone call volume from a specific zip code), you don’t need a deep-dive analysis to know that your local visibility in that area has likely slipped.
Leading Indicators vs. Lagging Indicators
- Lagging Indicators: Revenue, total customers, churn rate. These tell you what happened in the past. They are precise but slow.
- Leading Indicators: Form start-rate, cost-per-qualified-lead (CPQL), unread email rate. These tell you what is about to happen. They are less precise but allow for high-velocity decisions.
By prioritizing leading indicators, we help our clients find the 5% of data that actually moves the needle. This shift in focus transforms analytics from a “reporting function” into a “growth engine.”
Building a Decision-Ready Culture
At TrustMedia, we believe that analytics should be a conversation, not a presentation. We don’t just send you a PDF of charts; we provide “Performance Intelligence.” This means we give you the “Why” and the “What Next” immediately.
To increase your own velocity of insight, start by asking these three questions of every report you receive:
- What changed? (The Metric)
- Why did it change? (The Insight)
- What are we doing about it right now? (The Decision)
If your current marketing partner or internal team can’t answer the third question within minutes of seeing the data, you aren’t data-driven: you’re just data-burdened.

Success in the digital age isn’t about who has the biggest database. It’s about who has the shortest distance between a question and an answer. When you stop hoarding information and start prioritizing the speed of your decisions, you unlock a level of growth that “data volume” alone can never provide.
How long does it take for your data to become a decision?
At TrustMedia, we specialize in building high-velocity analytics frameworks that help businesses see the signal through the noise. We turn complex data into clear, actionable growth strategies. Ready to stop drowning in dashboards and start driving results? Partner with TrustMedia today.
What is the difference between data velocity and insight velocity?
Data velocity refers to the speed at which raw information (clicks, views, leads) is collected. Insight velocity is the speed at which that raw information is processed and understood to reveal a specific business opportunity or problem.
Why shouldn’t I wait for 100% accurate data before making a change?
In digital marketing, perfection is often the enemy of profit. Waiting for “perfect” data usually results in lost time and missed opportunities. Acting on “directional truth” (data that is 80-90% accurate) allows you to test and pivot faster, which is more valuable than being exactly right too late.
What are leading indicators in marketing analytics?
Leading indicators are metrics that predict future outcomes. For example, an increase in “Add to Cart” actions is a leading indicator for future sales. Monitoring these allows you to make adjustments before your final revenue numbers (lagging indicators) are affected.
How does “Decision Debt” affect my business?
Decision Debt occurs when you delay making a necessary change because you feel you need more information. Over time, these delayed decisions accumulate, leading to wasted ad spend, missed leads, and a slower overall growth rate compared to agile competitors.
How can I make my dashboards more “decision-ready”?
To make a dashboard decision-ready, remove any metric that doesn’t have a clear “if/then” action associated with it. Focus on 3-5 Key Performance Indicators (KPIs) that directly impact your bottom line and ensure they are updated frequently enough to allow for weekly or even daily adjustments.