You open your advertising dashboard and the numbers look spectacular. The Return on Ad Spend (ROAS) is sitting at a healthy 5.0x, the click-through rates are climbing, and the cost-per-click is lower than it was last quarter. By all traditional accounts, your digital marketing is a resounding success.
Yet, when you look at the company bank account or your net profit margins at the end of the month, the “success” shown on the screen isn’t showing up on the bottom line. This disconnect is what we call the Performance Mirage: a state where “Success Theater” in your ad accounts masks a fundamental drain on your business’s capital.
As digital ad spend approaches nearly $850 billion globally by 2026, the complexity of these platforms has reached a fever pitch. It is easier than ever to buy traffic, but it has never been harder to buy profitable growth. If you feel like you are spending more just to stand still, you aren’t alone. In fact, you are likely caught in a structural gap between platform metrics and business outcomes.
The ROAS Illusion: When Dashboards Lie
The obsession with ROAS (Return on Ad Spend) is perhaps the most dangerous trap in modern performance marketing. ROAS is a diagnostic metric, not a business goal. It tells you how much revenue was “attributed” to an ad, but it says nothing about profit, incrementality, or customer lifetime value.
Most ad platforms are designed to take credit for as many conversions as possible. If a customer sees your ad, ignores it, and then searches for your brand name on Google an hour later to buy, both Google and Meta might try to claim that sale. This creates an inflated sense of performance. That said, the real danger is not just over-attribution; it is the waste hidden in the signals you are optimizing for.
“Recent industry analyses indicate that roughly 40–60% of digital ad spend is effectively wasted due to poor targeting, low viewability, and fraud. Furthermore, platform-reported conversions are often 150–250% higher than actual revenue hitting the bank.” : Industry Market Analysis, 2025–2026
When you optimize for a “lower CPC” or a “higher CTR,” you are often unintentionally training the algorithm to find the cheapest, most clickable users: who are frequently the least likely to actually buy. This is where the mirage begins: your dashboard shows a “win,” but your business loses.
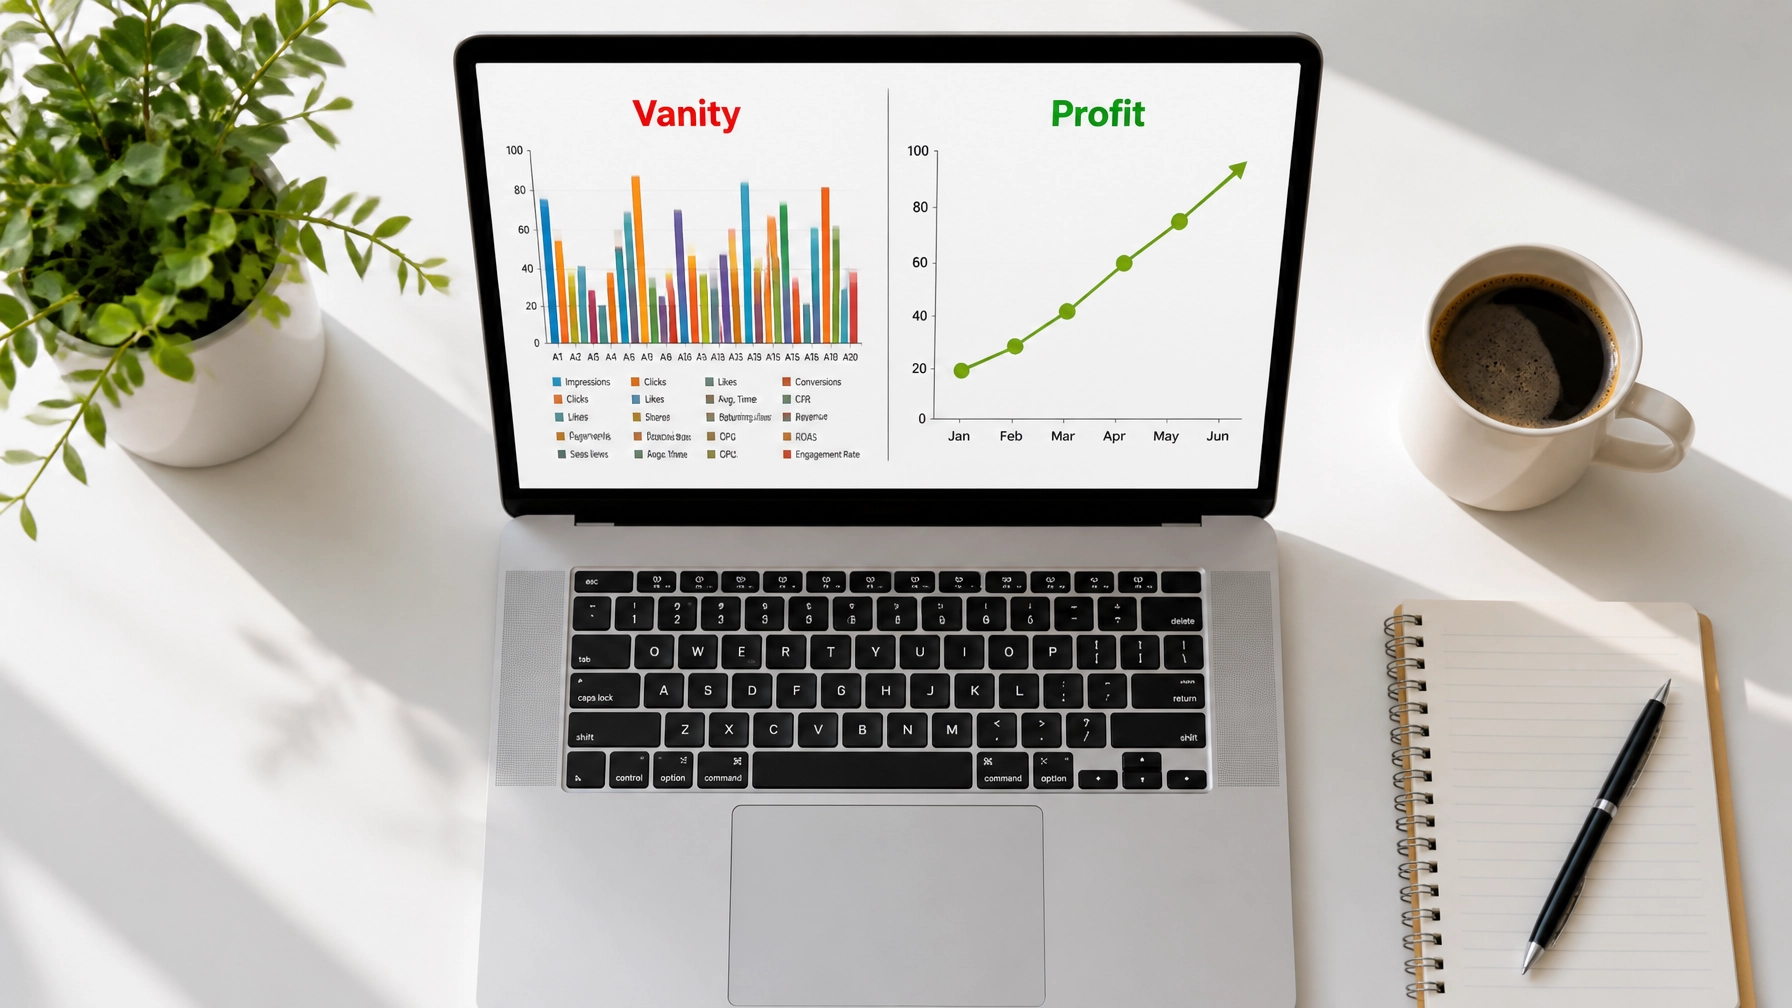
Vanity Metrics vs. Performance Metrics
To break the cycle of wasted spend, you must differentiate between metrics that make you feel good and metrics that make you money. If your current reports are dominated by impressions and “reach,” you are likely missing the signal for the noise.
| Vanity Metric | Why It Is Deceptive | Performance Metric | Why It Matters |
|---|---|---|---|
| Impressions | Counts how many times an ad was “served,” even if never seen. | Viewable Reach | Measures if a human actually had the ad on their screen. |
| CTR (Click-Through Rate) | High clicks often come from “accidental” or low-intent users. | Conversion Rate by Audience | Shows which specific segments actually take action. |
| CPC (Cost Per Click) | Cheap clicks are often low-quality or bot-driven. | CPA (Cost Per Acquisition) | The actual cost to acquire a paying customer. |
| Platform ROAS | Often over-attributed and ignores profit margins. | POAS (Profit on Ad Spend) | Calculates return based on net profit after all costs. |
| Total Clicks | Includes bots, crawlers, and accidental thumb-taps. | Engaged Sessions | Clicks that result in meaningful time spent on your site. |
The Campaign Context Gap
One of the biggest reasons ad spend disappears is a lack of “campaign context.” This is the gap between what a click costs and what that specific customer is actually worth to your business over time.
Many businesses treat digital advertising as a “vending machine”: you put a dollar in and expect two dollars out. In practice, advertising works more like a high-precision filter. If your targeting is broad, your filter is too wide. You might be getting clicks from people who are “browsing” but have zero intent to solve a problem today.
For example, a home remodeling contractor might run ads for “kitchen ideas.” They will get thousands of clicks (the dashboard looks great!), but 99% of those people are just looking for inspiration, not a $50,000 renovation. By failing to align the offer with the intent, the business is essentially subsidizing the curiosity of the internet rather than driving leads.
This is why analytics are often rich in data but poor in direction. Without understanding the behavior behind the click, you are just buying numbers on a screen.
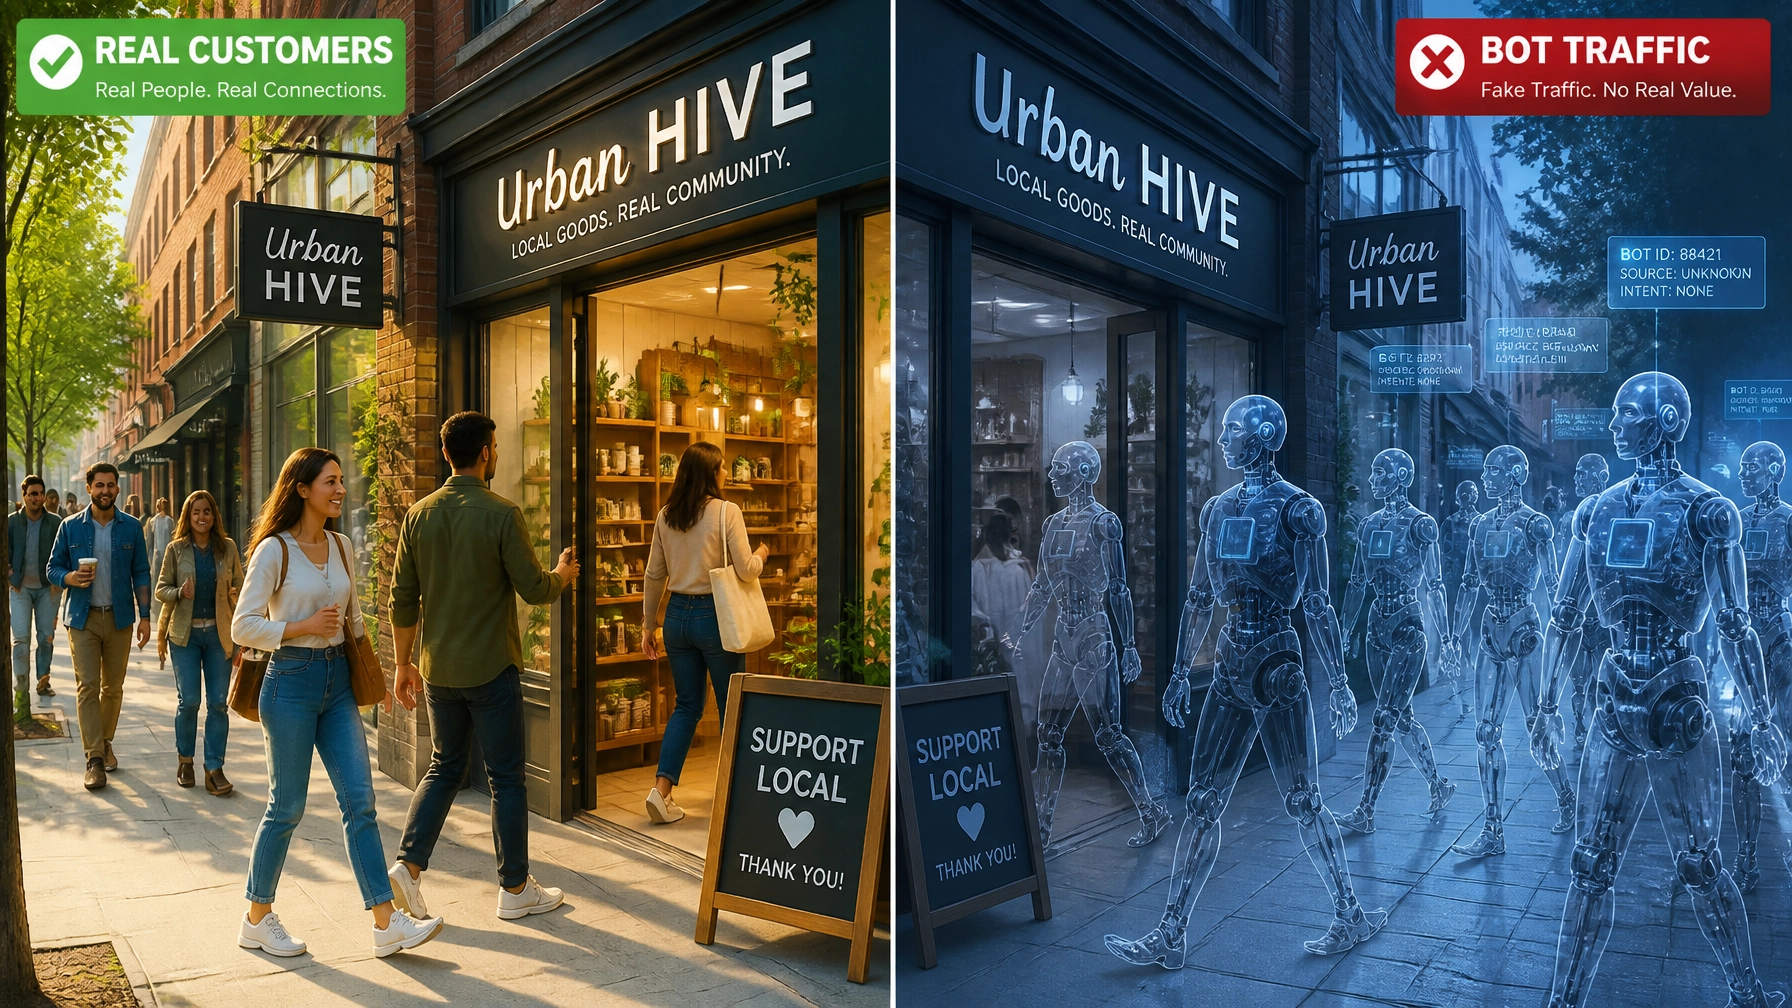
Challenging Outdated Growth Assumptions
For years, the “best practice” was simple: spend more to grow more. In the high-privacy, high-competition landscape of 2026, this advice is not just outdated: it is reckless.
1. The “More Budget = More Growth” Fallacy
Algorithms have a “saturation point.” If you double your budget, you rarely double your results. Instead, you often just force the platform to show your ads to lower-quality audiences just to spend your money. True growth comes from finding the 5% of your data that actually moves the needle and scaling that, rather than throwing more money at a leaky funnel.
2. The “Broad Targeting” Myth
While platforms like Meta love to suggest “broad targeting” to let their AI work, this only works if your creative is doing the heavy lifting of disqualifying the wrong people. If your ad is too generic, broad targeting will simply find you the cheapest clicks, regardless of their intent. In other words, if you don’t tell the algorithm who you don’t want, it will spend your money on everyone.
Actionable Optimization: Where to Fix the Leak
If you suspect your ad spend is underperforming, stop looking at your campaign settings and start looking at the user journey. Here are four strategic levers that actually move the needle:
Audience Layering (Intent Over Interest)
Stop targeting “Interests” (like “interested in fitness”) and start layering behavioral data. Use your first-party data (customer lists) to build lookalikes of your best customers, not just your recent customers. Exclude people who have already bought or those who spend less than 10 seconds on your site.
Offer-Message-Match
Does the promise in your ad match the reality on your landing page? If your ad promises a “Free Consultation” but your landing page asks them to “Buy Now,” you have created friction. This friction is where conversions go to die. Ensure website clarity drives your conversions by keeping the promise consistent from click to checkout.
Conversion Path Auditing
Sometimes the ad is fine, but the “bridge” is broken. If your mobile site takes 4 seconds to load, you have likely lost 50% of your paid traffic before they even saw your logo. Audit your path for “micro-doubts”: the small points of confusion that make a user hit the ‘back’ button.
Creative Fatigue Rotation
Even the best ad has a shelf life. “Creative fatigue” happens when your frequency gets too high and your audience stops seeing your ad even when it’s right in front of them. You don’t need a massive production budget; you need variation. Test a “problem-focused” ad against a “results-focused” ad to see which narrative resonates with your current market.

The Path to Performance Intelligence
At TrustMedia, we believe that advertising is not about spending; it’s about buying clarity. When you stop chasing vanity metrics and start measuring business outcomes, the mirage disappears. You begin to see where the waste hides: in the unviewed display ads, the over-attributed retargeting clicks, and the creative that no longer converts.
The goal of your digital advertising should be to build a predictable, scalable engine for growth. That requires a shift from being “platform-first” to being “profit-first.” It requires questioning why a campaign that “looks good” isn’t delivering, and having the strategic courage to cut the spend that isn’t moving the needle.
Ready to see through the mirage? Stop optimizing for the platform and start optimizing for your P&L.
Why is my ROAS high but my profit low?
This usually happens due to “attribution inflation.” Ad platforms often take credit for sales that would have happened anyway (like people searching for your brand name). If you are heavily invested in retargeting existing customers, your ROAS will look great, but you aren’t actually driving new incremental growth.
How do I know if my ads are being seen by bots?
Check your “Invalid Traffic” (IVT) rates and look for red flags in your analytics, such as extremely high bounce rates (90%+) combined with very short session durations (less than 2 seconds). High-quality traffic should result in a “meaningful” session where the user actually interacts with your content.
Should I always use the “Recommended” settings from Google or Meta?
Not necessarily. Platform recommendations are often designed to increase the amount of inventory they can sell (like “Search Partners” or “Audience Network”), which are frequently lower quality. Always test these recommendations against a controlled “manual” setup to see if they actually improve your CPA.
How often should I change my ad creative?
It depends on your audience size and spend. A good rule of thumb is to monitor your “Frequency” and “CTR” trends. When your frequency passes a 3.0 or 4.0 and your CTR begins to dip, it’s a clear signal that your audience has developed “ad blindness” and you need to rotate in new creative variations.
What is the single biggest waste of ad spend for local businesses?
Targeting too broad of a geographic area. For local service-based businesses, a click from 50 miles away is often a 100% waste of money if you cannot realistically service that lead. Tighten your radius and use “negative keywords” aggressively to ensure you are only paying for local, high-intent traffic.