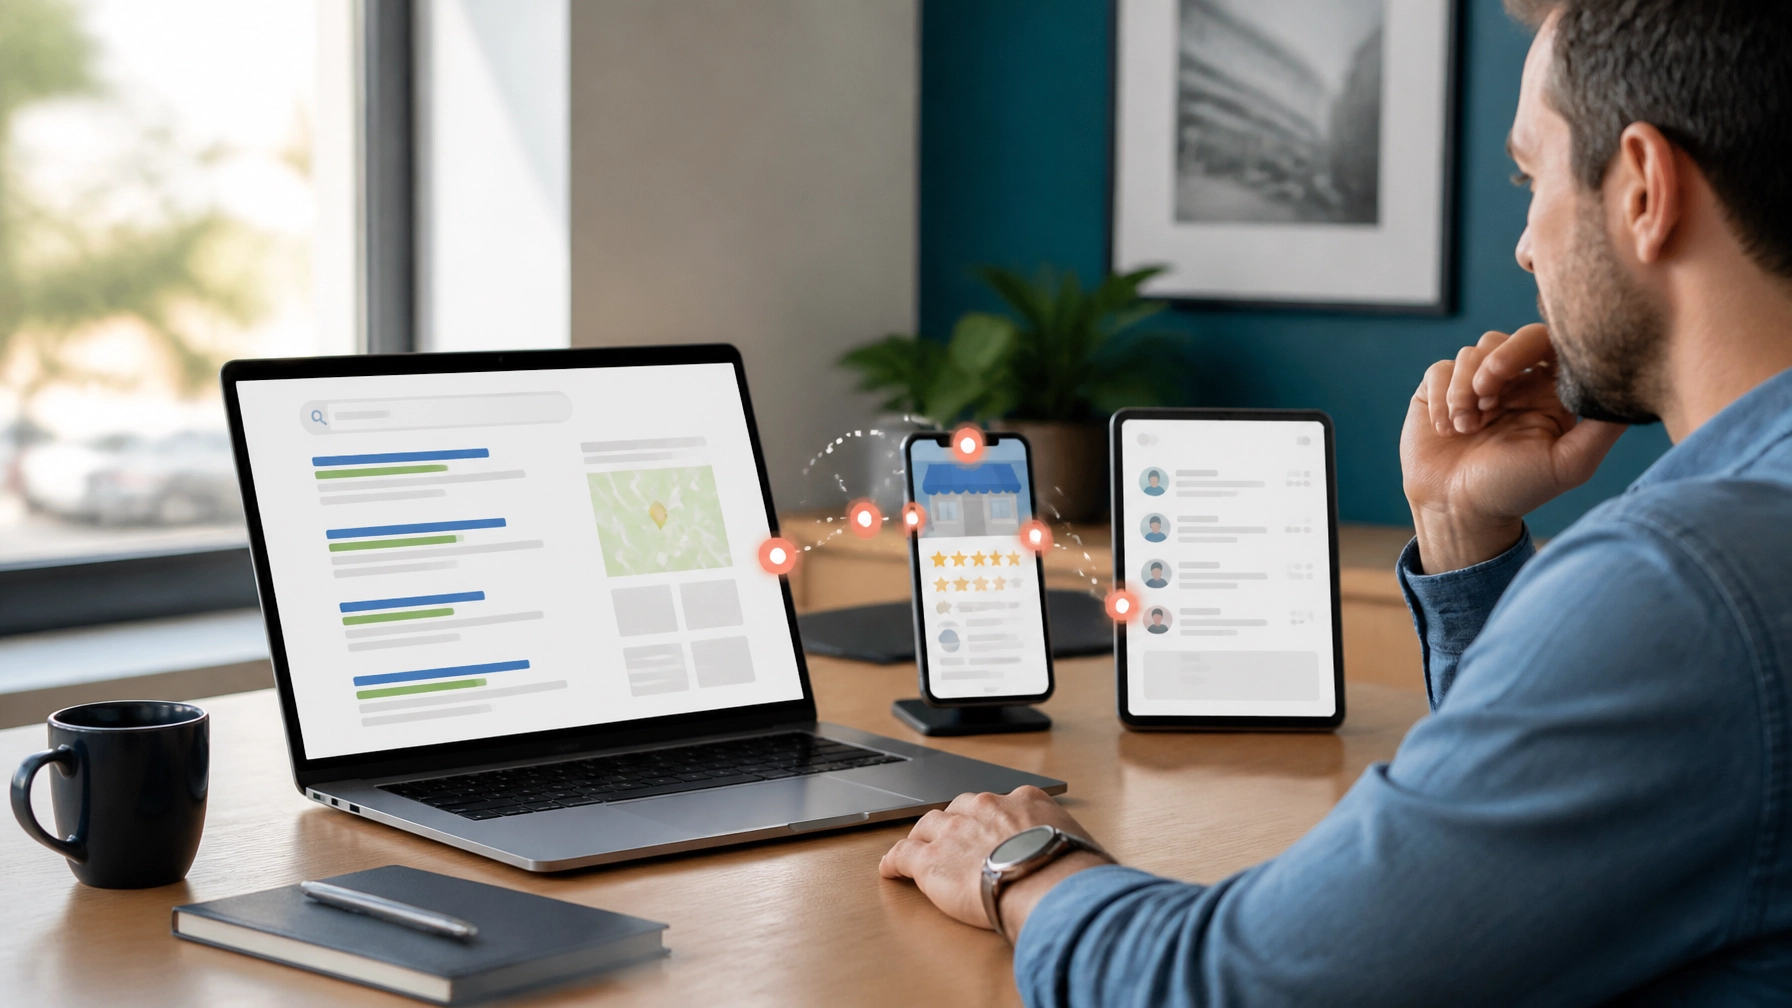
Most business owners believe they have a data problem, but they actually have a clarity problem. We live in an era where every click, scroll, and hover is logged, timestamped, and beamed into a dashboard. You aren’t suffering from a lack of information; you are likely drowning in it.
The prevailing myth in digital marketing is that more data leads to better decisions. In reality, the more data you collect, the higher the “noise floor” becomes. When your dashboard is screaming at you with 50 different metrics, the signals that actually matter, the ones that tell you why your revenue grew or why your lead quality dropped, get buried.
True performance intelligence isn’t about tracking everything. It’s about the surgical extraction of the 5% of data that actually dictates your next move.
The Signal vs. Noise Framework
In the world of analytics, “signal” is the information that accurately reflects human behavior and business outcomes. “Noise” is the clutter, bot traffic, vanity metrics, and short-term fluctuations that look like trends but offer no strategic value.
As we move deeper into 2026, the noise floor is rising. Generative AI is flooding the web with synthetic content, and bot traffic now accounts for a staggering portion of total web activity. If you are making decisions based on raw traffic numbers, you aren’t just looking at noise; you might be looking at “statistical ghosts.”
To find the signal, you must evaluate every metric through a simple lens: If this number changed by 20% tomorrow, would I change my business strategy?
If the answer is no, that metric is noise. It might be interesting, but it isn’t actionable. This is the foundation of The Interpretation Gap, where businesses possess mountain of data but remain poor in direction because they haven’t filtered for signal.
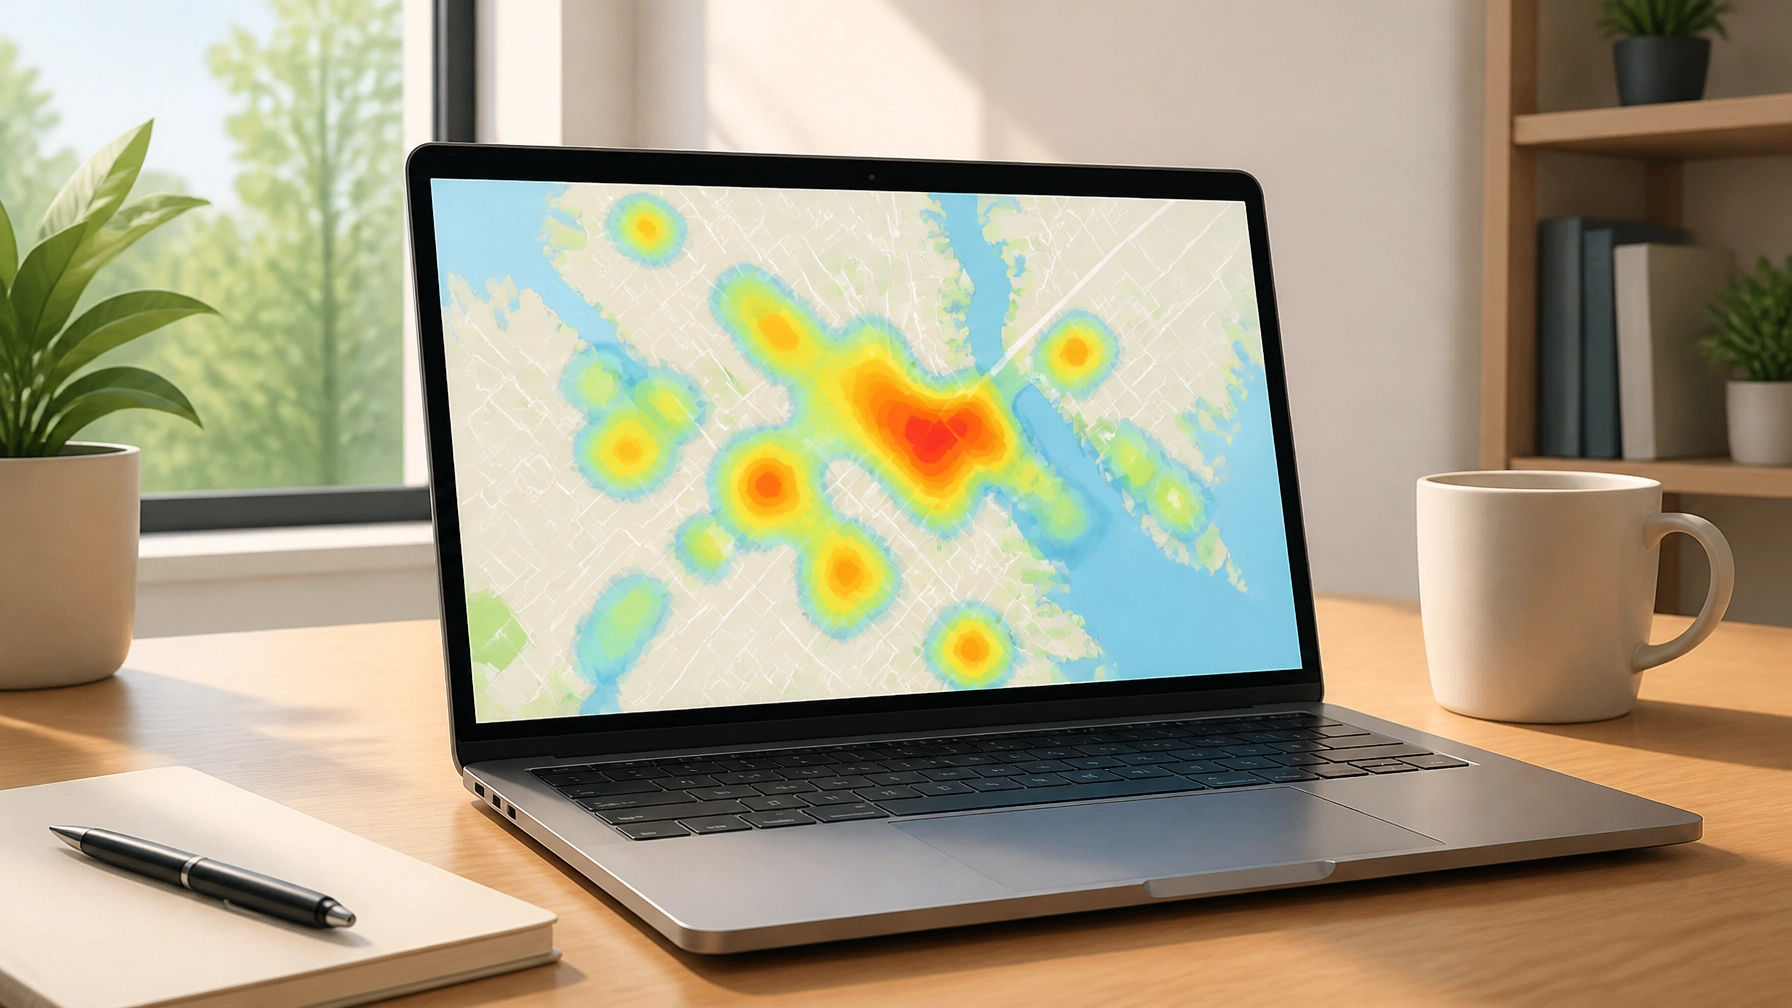
Moving from Metrics to Insights
A metric is a number. An insight is the “so what” behind that number.
Many marketing teams spend hours reporting that “Click-Through Rate is up 12%.” That is a metric. An insight would be: “Our Click-Through Rate is up 12% among homeowners over 45, but lead conversion remains flat, suggesting our landing page offer doesn’t align with this specific demographic’s urgency.”
The metric tells you what happened. The insight tells you why it happened and what to do next. When you stop looking at dashboards as report cards and start looking at them as diagnostic tools, your relationship with data transforms.
“Data literacy is becoming a core language of business, needed across roles because data is now woven into almost every decision.” : Industry Benchmark Report, 2026.
Here is how to distinguish between vanity metrics that feed the ego and useful insights that feed the business:
| Vanity Metric (The Noise) | Useful Business Insight (The Signal) | Actionable Decision Trigger |
|---|---|---|
| Total Website Traffic | Qualified Traffic by Source | “Shift 15% of the budget from Social to Search where lead intent is higher.” |
| Raw Lead Count | Cost Per Qualified Lead (CPQL) | “Audit the lead magnet because raw leads are up, but sales-ready leads are down.” |
| Social Media Followers | Audience Engagement Depth | “Double down on video content as it’s driving 3x more direct site visits than static posts.” |
| Ad Impressions | Share of Voice in High-Value Zip Codes | “Increase local bid adjustments in the north district where competitor presence is low.” |
| Average Time on Site | Conversion Path Velocity | “Simplify the ‘Book Now’ process as users are spending 3 minutes in the checkout without finishing.” |
Leading vs. Lagging Indicators: Predicting the Future
One of the biggest mistakes in marketing analytics is relying solely on lagging indicators.
Lagging indicators are outcome-based. Revenue, customer acquisition cost, and net profit are all lagging indicators. They tell you how you did. By the time a lagging indicator shows a downward trend, the damage is already done. The events that caused the drop are “finished and immutable.”
Leading indicators are forward-looking. They react quickly to your current actions and help predict future performance. For a local service business, a leading indicator might be the number of “Request a Quote” forms started but not finished, or the volume of phone calls originating from a specific Google Maps radius.
In practice, if your leading indicators (like trial sign-ups or high-intent page views) are climbing, your lagging indicators (revenue) will almost certainly follow in the next 30 to 60 days. By monitoring these early signals, you can course-correct in real-time rather than waiting for a month-end report to tell you that you missed your targets.

Attribution and the Messy Middle
The path from “stranger” to “customer” is rarely linear. A homeowner might see your Google Ad, browse your site, leave, see a retargeting ad on Facebook three days later, and then finally call you after finding your profile on a local directory.
This is the “messy middle” of the conversion path. If you use “Last-Click Attribution,” your directory gets all the credit, and you might mistakenly kill the Google Ad that actually introduced the customer to your brand. This leads to The Performance Mirage, where your ad spend appears to be failing because you aren’t seeing the full story of the customer journey.
Modern performance intelligence uses “Signal Engineering.” Instead of just tracking the final sale, we track the micro-conversions along the way.
- Did they view your “Meet the Team” page? (Signifies trust-building)
- Did they download a pricing guide? (Signifies intent)
- Did they interact with a project gallery? (Signifies solution-seeking)
By understanding the sequence of these signals, you can identify where people are dropping off. If 80% of your visitors leave after seeing your pricing page, the problem isn’t your ads; it’s your pricing transparency or the way your value proposition is framed.
The Strategic Observation: Decision Thresholds
The goal of analytics isn’t to be 100% right; it’s to be confident enough to act. Many business owners fall into “analysis paralysis” because they are waiting for perfect data.
In the real world, 80% certainty is often the optimal point for a decision. If you wait for 100% certainty, the opportunity has usually passed, or your competitors have already pivoted. This is where The Silent Audit comes into play: your customers are constantly evaluating your data signals (like reviews and response times) before they ever talk to you. You should be doing the same with your internal data.
Strategic decision-making requires setting “Decision Thresholds.” For example:
“If our Cost Per Lead exceeds $60 for more than seven consecutive days, we automatically pause the campaign and audit the landing page.”
Having these thresholds in place removes the emotion from marketing. It turns data into a system of triggers rather than a source of anxiety.
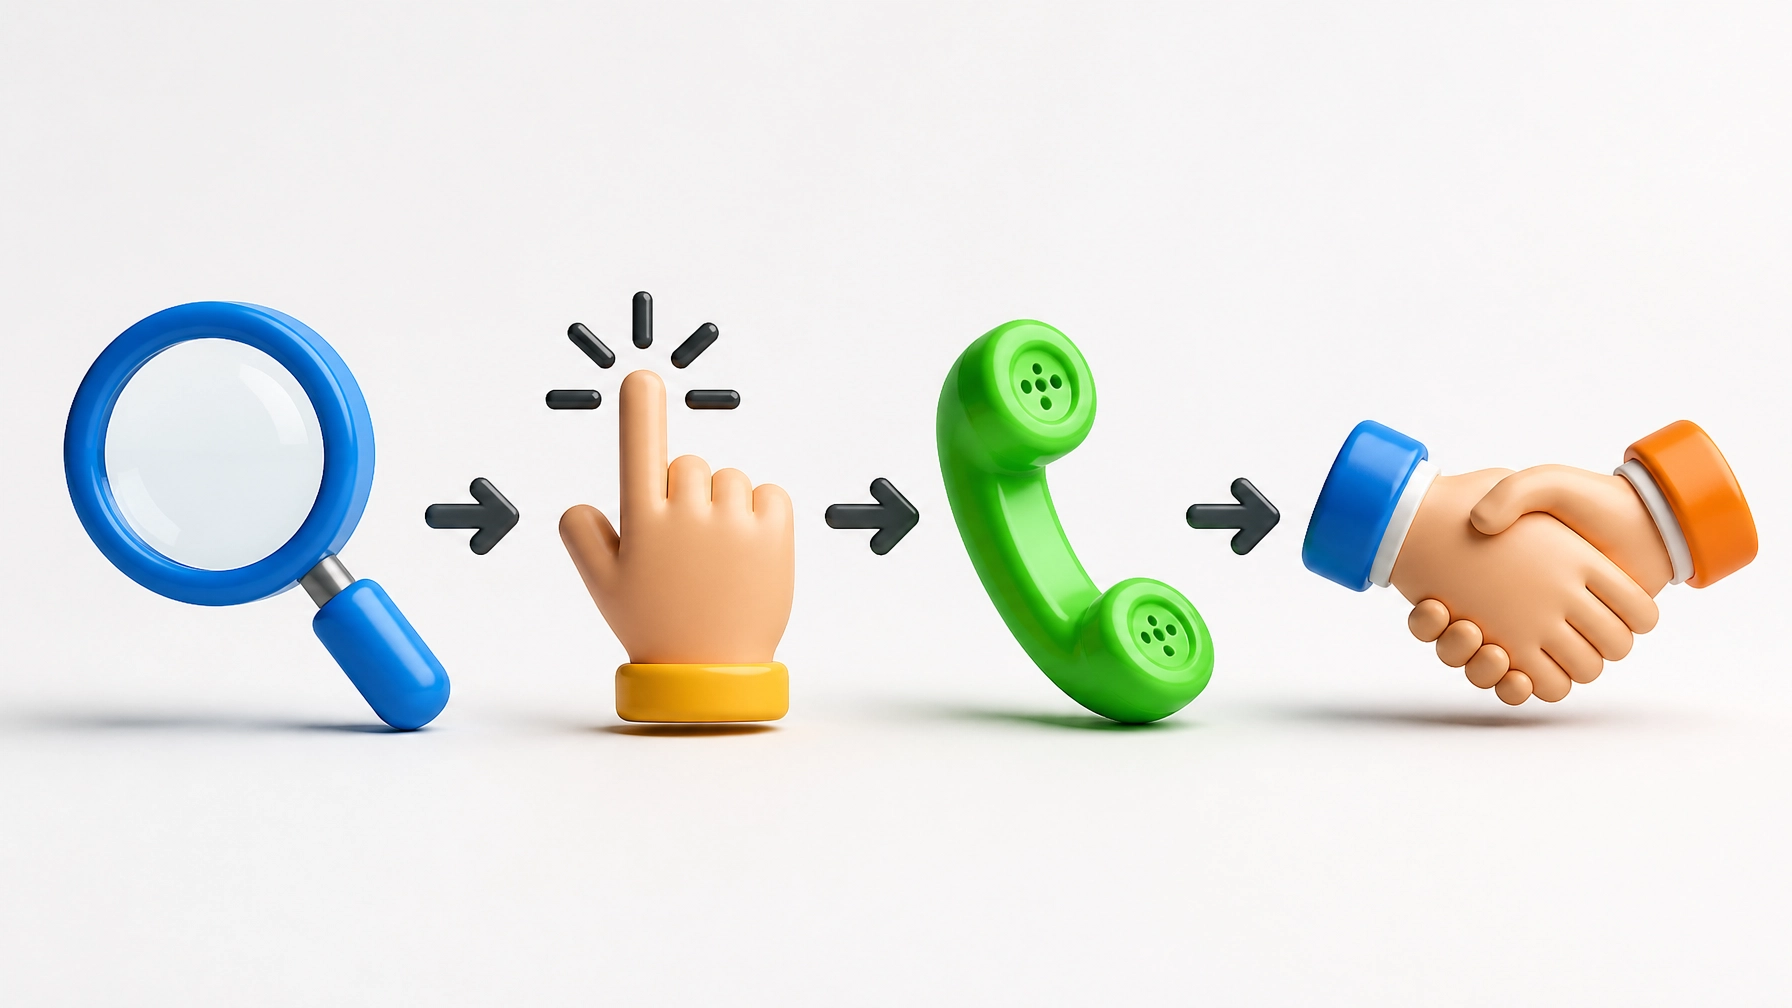
Reinforcing Performance Intelligence
At TrustMedia, we don’t just hand you a dashboard and wish you luck. We act as the filter between the noise of the digital world and the signal of your business growth. We believe that analytics should be a compass, not just a speedometer. It shouldn’t just tell you how fast you’re going; it should tell you if you’re headed toward a cliff or a gold mine.
When you focus on the 5% of data that matters, you stop “managing spreadsheets” and start “leading a growth engine.” You gain the ability to spot inflection points before they happen and the confidence to double down on what works while cutting the dead weight of vanity metrics.
That is the power of the decision signal. It’s the clarity to see the path forward in a world that is increasingly loud, cluttered, and confusing.
What is the difference between a KPI and a leading indicator?
A Key Performance Indicator (KPI) is a high-level metric that measures overall success, such as annual revenue or total customer count. A leading indicator is a specific, early-stage metric that predicts the movement of that KPI. For example, if your KPI is “New Customers,” a leading indicator would be “Inbound Consultation Requests.”
Why does my Google Analytics traffic look higher than my actual lead volume?
This is the classic “Signal vs. Noise” problem. High traffic with low leads often suggests “noise” from bot traffic, non-local visitors, or a “Performance Mirage” where ads are attracting clicks but not conversions. You must filter your traffic by geographic location and engagement duration to find the true “human” signal.
How often should I check my marketing dashboards?
For most business owners, checking daily is unnecessary and can lead to overreacting to minor fluctuations (noise). We recommend a weekly review of leading indicators to make tactical adjustments and a monthly review of lagging indicators to evaluate overall strategy.
What is the most important metric for a local service business?
While every business is different, “Cost Per Qualified Lead” (CPQL) is usually the strongest signal. It bypasses vanity metrics like impressions and clicks and focuses strictly on what it costs to get a high-intent prospect into your sales funnel.
What should I do if my data is telling me something I don’t like?
Lean into it. Negative data is often a more valuable signal than positive data because it identifies friction. If your conversion rate is dropping, it’s an invitation to audit your user experience, your offer, or your competitive positioning. Data is a diagnostic tool, not a personal critique.